

A robot can have sophisticated artificial intelligence, expensive sensors, and enough computing power to navigate a warehouse. But if it cannot determine its position accurately, all that intelligence has a rather expensive problem.
GEODNET wants to solve it.
The decentralized infrastructure project operates a global network of satellite-positioning reference stations that help drones, agricultural machinery, surveying equipment, and autonomous systems locate themselves with centimeter-level precision.
Unlike many crypto projects selling visions of future adoption, GEODNET can point to operating infrastructure, commercial partnerships, and growing revenue.
Its token, GEOD, has another selling point: a mechanism designed to use part of the network’s revenue to buy back tokens and remove them from circulation.
That combination sounds like the beginning of a compelling hidden-gem story.
But Ravel’s examination of GEODNET’s financial disclosures, token economics, and publicly available blockchain data reveals an important complication. The relationship between business revenue and token value is less straightforward than the headline figures suggest.
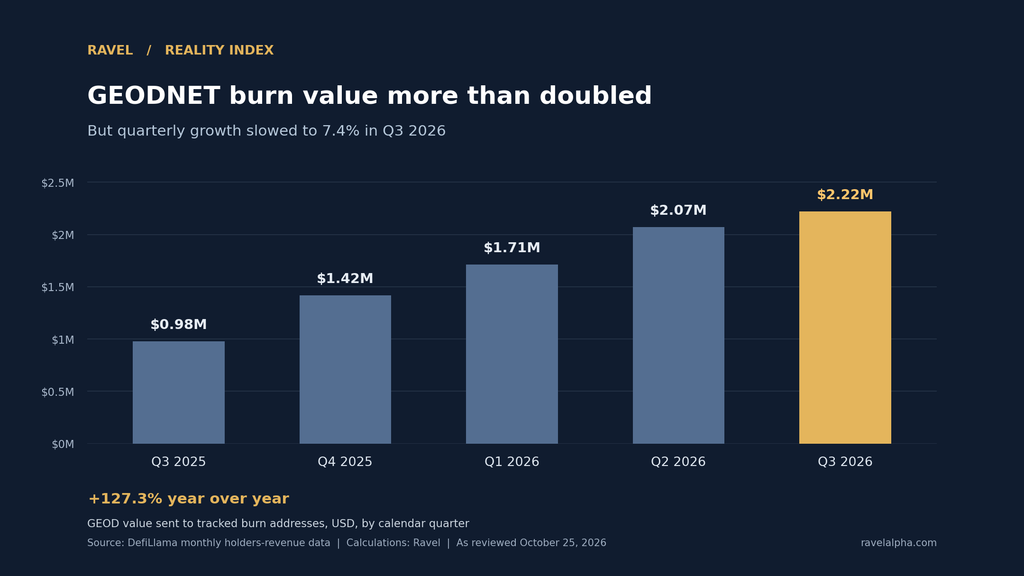
Our calculations show that the dollar value of GEOD sent to tracked burn addresses increased 127.3% year over year in the third quarter of 2026. Yet quarterly growth slowed to 7.4%, while a significant portion of the token’s maximum supply remains outside reported circulation.
The question is no longer whether GEODNET has an interesting business.
It is whether GEOD investors are paying a reasonable price for the value that the business actually delivers to the token.
A Crypto Network With Customers Beyond Crypto
Most decentralized physical infrastructure networks, or DePIN projects, face the same uncomfortable question: does the network exist because customers need its services, or because token rewards make it profitable to build?
GEODNET has a stronger answer than many early-stage networks.
According to its official network documentation, GEODNET uses community-operated GNSS reference stations to collect satellite observations and provide precise positioning corrections.
The resulting Real-Time Kinematic, or RTK, data enables compatible equipment to determine its location far more precisely than conventional standalone GPS.
The commercial applications are not difficult to imagine.
A surveying drone needs accurate coordinates. An autonomous tractor needs to follow repeatable routes. A construction company needs reliable measurements. A robot working outdoors needs to understand exactly where it is.
GEODNET provides the underlying positioning infrastructure rather than manufacturing every device that uses it.
There is evidence of commercial integration, too.
In April 2025, DroneDeploy and GEODNET announced a partnership making GEODNET’s RTK network available to DroneDeploy customers involved in construction, mining, energy, and utilities.
An announced integration does not prove how much revenue an individual customer generates. Still, it provides a recognizable commercial use case beyond the crypto industry’s usual partnership announcements.
The project’s October 24, 2026 business update reported more than 22,000 reference stations, over 165 enterprise customers, and annual recurring revenue of $10.64 million.
Those are company-reported figures, not independently audited results obtained by Ravel.
But they establish a meaningful starting point.
GEODNET has operating infrastructure and customers it identifies as paying for positioning services.
The more interesting question is what happens to the money.
Follow the Revenue, Then Follow the Burn
GEODNET’s most attractive tokenomics feature is its buyback-and-burn mechanism.
Rather than relying entirely on speculative token demand, the system is designed to connect commercial activity to purchases of GEOD.
The basic proposition is appealing: more paying customers generate more revenue, which finances additional token purchases and burns.
There is, however, a distinction between revenue generated by the broader business and the portion allocated to the token.
In a token transparency filing dated August 19, 2025, GEODNET disclosed that it shared 50% of enterprise subscription revenue with the GEODNET Foundation.
The filing stated that 80% of the Foundation’s share was used for buying back and burning GEOD.
The arithmetic is straightforward.
For every $100 of enterprise subscription revenue covered by that disclosed arrangement, $50 would flow to the Foundation. Eighty percent of the Foundation’s $50 share would represent $40 allocated to token buybacks and burns.
Under the structure described in 2025, that amounts to 40% of the original enterprise subscription revenue.
But that calculation does not establish that GEODNET was still operating under an identical revenue-sharing structure in October 2026.
The distinction matters because GEODNET’s more recent public statements describe 80% of data service revenue going toward buybacks and burns.
Those statements may refer to the Foundation’s recognized revenue, a narrower category of services, or an updated commercial arrangement.
Ravel could not locate a later public financial disclosure that explicitly reconciles the August 2025 enterprise revenue-sharing structure with the October 2026 description.
There is insufficient evidence to conclude that the policy changed or that either statement is necessarily inaccurate.
The unresolved issue is the definition of revenue being used.
That distinction becomes even more important when examining third-party financial dashboards.
Ravel reviewed the open-source GEODNET adapter maintained by DefiLlama.
The code identifies GEOD transfers to designated burn destinations on Polygon and Solana, values those transfers, and reconstructs service fees based on an 80% allocation assumption.
In simplified terms:
Estimated service fees = value of tracked token transfers to burn destinations ÷ 0.80
That is a consequential methodological detail.
DefiLlama’s estimated revenue is not independently imported from customer invoices or audited financial statements. It is reconstructed from token movements using an assumed relationship between service fees and burns.
As a result, the revenue and burn figures cannot be treated as two independent datasets confirming each other.
They are mathematically connected.
This does not establish that GEODNET’s reported revenue is inaccurate. It establishes what the public dashboard can independently demonstrate.
For investors trying to value the token, that distinction matters considerably.
GEOD’s Burn Value Doubled, But Growth Is Slowing
Using DefiLlama’s historical GEODNET data, Ravel reconstructed the quarterly dollar value of token transfers counted as buybacks and burns.
| Quarter | Tracked burn value |
|---|---|
| Q3 2025 | $977,639 |
| Q4 2025 | $1,419,604 |
| Q1 2026 | $1,711,925 |
| Q2 2026 | $2,069,193 |
| Q3 2026 | $2,222,055 |
The trajectory is encouraging.
The measured dollar value rose from just under $978,000 in Q3 2025 to more than $2.22 million one year later.
That represents year-over-year growth of 127.3%.
But the most recent quarter tells a more restrained story.
Between Q2 and Q3 2026, the value increased only 7.4%. September’s $731,103 was also below August’s $755,442.
These figures do not independently establish that customer demand slowed. Token prices, purchasing schedules, and differences in transaction timing can affect the dollar value assigned to burns.
What they demonstrate is that growth in the tracked dollar-denominated burn series moderated substantially during Q3.
The same data raises a valuation question.
Under DefiLlama’s methodology, the $2.22 million tracked burn value for Q3 implies around $2.78 million in estimated quarterly service fees.
If the August 2025 revenue-sharing structure still applied unchanged, and the same measured amount represented exactly 40% of gross enterprise subscription revenue, the corresponding gross amount would instead be around $5.56 million.
That second figure is a hypothetical calculation, not a verified estimate of GEODNET’s actual quarterly sales.
The two calculations depend on different definitions of revenue. Ravel has not established that the relevant transactions, service categories, and accounting periods are directly comparable.
Therefore, the difference should not be interpreted as evidence of hidden revenue, inaccurate reporting, or an undisclosed change in commercial terms.
Rather, it highlights information that would make the financial picture easier to evaluate.
A fully reconciled disclosure would distinguish gross enterprise subscription revenue, the Foundation’s share, the actual amount used for purchases, and the value of tokens removed from economic circulation.
Until those numbers connect, any revenue-based token valuation requires caution.
Token Burns Are Only Half the Supply Story
Burning tokens sounds deflationary.
But token economics has two sides: tokens leaving circulation and tokens becoming available to holders.
GEODNET must continuously incentivize the operators who maintain its physical infrastructure.
Its official tokenomics documentation describes a maximum allocation of 1 billion GEOD, including a mining reward pool and separate allocations for investors, team members, ecosystem development, vendors, and public-sale participants.
Mining rewards are distributed to operators, while other allocations follow multiyear distribution schedules.
A token can therefore experience rising burn activity while additional tokens are simultaneously released from previously allocated reserves.
A daily observation from October 24 illustrates the distinction.
DefiLlama’s distribution data recorded 84,499 GEOD in mining rewards against 70,000 GEOD in burns.
Mining distributions exceeded burns by 14,499 GEOD for that day.
This observation does not establish that total supply increased by precisely that amount. Mining rewards can come from existing allocations, while transfers from restricted wallets and cross-chain balances complicate circulating-supply calculations.
It also represents only one day, not a sustained trend.
Still, it explains why burn figures alone are insufficient to establish ongoing token scarcity.
There is also a more immediate question: how much additional GEOD could become available during the final week of October?
According to Blockworks’ vesting calendar, approximately 15.94 million GEOD is scheduled for release on October 28, 2026.
The calendar attributes 12.5 million GEOD to the team allocation, around 2.08 million to the ecosystem, 833,333 to public-sale allocations, and 520,833 to vendors and marketing.
At a token price around $0.25, the scheduled amount would have a notional value close to $4 million.
However, that figure requires an important qualification.
A scheduled unlock is not the same as a confirmed blockchain transfer, an immediate increase in exchange liquidity, or a decision by recipients to sell.
Moreover, the available calendars do not agree.
DefiLlama’s unlock tracker reported no upcoming scheduled GEOD unlocks as of October 24, while other independent tracking services use different entitlement dates.
Ravel has not independently verified that the entire Blockworks-scheduled amount will be released or transferred on October 28.
The defensible conclusion is therefore narrower: Blockworks identifies a significant scheduled vesting event, but its actual effect on liquid supply remains unconfirmed.
Another complication comes from GEOD’s presence on Polygon and Solana.
The project uses cross-chain infrastructure to move token representations between networks. As Wormhole’s transfer documentation explains, these systems can involve locking tokens on one blockchain while creating corresponding representations elsewhere.
That means balances visible on separate chains cannot automatically be added together as economically distinct supply.
Ravel has not completed a wallet-by-wallet reconciliation of every relevant cross-chain balance, escrow contract, and vesting allocation.
For that reason, the available evidence does not justify claiming that GEODNET has a hidden supply problem.
It does justify treating token distribution and circulating-supply reconciliation as important risks within the investment thesis.
What Is GEOD Actually Worth?
As of Ravel’s October 25, 2026 review, market data placed GEOD around $0.25, with a circulating market capitalization near $114 million and fully diluted valuation around $230 million.
Those figures create rather different impressions when compared with the project’s estimated economic activity.
DefiLlama’s Q3 service-fee estimate of about $2.78 million translates to an annualized pace of roughly $11.11 million when multiplied by four.
Using those figures, Ravel calculates the following indicative ratios:
- Circulating market capitalization / annualized estimated service fees: around 10 times.
- Fully diluted valuation / annualized estimated service fees: around 21 times.
- Annualized tracked burn value / circulating market capitalization: roughly 7.8%.
- Annualized tracked burn value / fully diluted valuation: roughly 3.9%.
These are analytical comparisons, not audited financial multiples.
Annualization assumes the quarter’s activity continues for an entire year. The service-fee denominator comes from DefiLlama’s burn-based methodology rather than independently audited customer sales.
The burn-to-valuation ratios are also not dividend yields or contractual cash distributions to investors.
Burns may reduce economically available token supply, but holders do not automatically receive cash or ownership rights.
The difference between circulating and fully diluted valuation is particularly important.
At the observed market price, fully diluted valuation is roughly twice the circulating market capitalization.
That means a hidden-gem thesis based only on the circulating market cap could understate the economic significance of tokens that are not yet circulating.
There is a credible bullish argument.
If GEODNET continues to expand its paying customer base, increases recurring commercial revenue, and sustains its buyback mechanism, growing demand for positioning services could strengthen the token’s economic case.
The bearish argument is equally relevant.
Additional token distributions may offset some of the scarcity created by burns. Revenue definitions still require reconciliation. And a business can perform well without its token delivering comparable investment returns.
The project’s technology could become substantially more important without GEOD necessarily becoming proportionally more valuable.
That is the distinction many hidden-gem discussions skip.
The Ravel Verdict: Promising Fundamentals, Unproven Undervaluation
GEODNET deserves attention for reasons extending well beyond its token.
It has operating infrastructure, identifiable commercial applications, announced enterprise integrations, and a mechanism intended to connect network revenue with GEOD demand.
The tracked buyback-and-burn data also demonstrates significant growth over the past year.
Those are stronger foundations than a speculative roadmap alone.
But our analysis does not establish that GEOD is cheap.
The relationship between gross enterprise revenue, foundation receipts, and token purchases requires more transparent reconciliation.
The supply picture requires monitoring of mining distributions, vesting, and cross-chain balances.
And the gap between circulating and fully diluted valuations complicates any simple argument that the token is overlooked.
For Ravel’s inaugural Hidden Gems investigation, the conclusion is therefore deliberately qualified:
GEODNET is a credible fundamental research candidate. GEOD’s undervaluation remains unproven.
There is a certain irony in a project whose entire business depends on knowing exactly where things are.
For GEOD investors, the most important coordinates are still the ones connecting customer revenue, token supply, and price.
Until those three points line up, the map is incomplete.
Ravel Methodology — October 25, 2026
Ravel reconstructed quarterly tracked burn values by summing DefiLlama’s monthly holders-revenue observations from July 2025 through September 2026. Percentage growth was calculated from unrounded quarterly totals. Estimated quarterly service fees were obtained by dividing tracked burn value by 0.80, consistent with DefiLlama’s reviewed open-source adapter. Annualized valuation comparisons use Q3 2026 estimates multiplied by four.
The August 2025 revenue-sharing calculation is conditional and should not be interpreted as verification of current commercial arrangements. Unlock dates are attributed to individual providers and have not been independently confirmed as executed transactions. This analysis is not a financial audit or a completed cross-chain supply reconciliation.
This article is independent fundamental research and does not constitute investment advice.